Learnign target: students can model multiple years at a time with compound interest.

Showing posts with label exponential functions. Show all posts
Showing posts with label exponential functions. Show all posts
Thursday, November 14, 2013
Friday, November 8, 2013
Exponential Alice
Learning target: students can model exponential situations.
 Dispite the fact that I;ve been writting equations with ratios like this for some time students still want to multiply the 4 by 30% and add it back on to 4. Aside from the fact that such steps make it hard to see what the pattern is (are we multiplying or adding? Both?) the only problem I see with this is an economy of calculations, if a student makes a mistake they feel like they have to start over because they were balancing so many things in their head at the time.
 On the worksheet students are asked to calculate how tall she would be if she ate 2 oz of cake. When students rush to calculate 2 oz without first calculating 1 oz they usually do 4(1.00+.60) because 30%+30%=60%.


 When modeling this with an equation a common mistake is for students to write y=x(1.3), mixing up the recursive and explicit method of describing this pattern.

Then, every so often I can tell that students want to know this stuff. I find evidence of a student putting in EXTRA effort to make sense of a problem. #2 show the meaning of each part of this equation. Beautiful.
Here is an available version of the worksheet:
This was a good lesson for sorting out repeated multiplication issues.
 Dispite the fact that I;ve been writting equations with ratios like this for some time students still want to multiply the 4 by 30% and add it back on to 4. Aside from the fact that such steps make it hard to see what the pattern is (are we multiplying or adding? Both?) the only problem I see with this is an economy of calculations, if a student makes a mistake they feel like they have to start over because they were balancing so many things in their head at the time.
 On the worksheet students are asked to calculate how tall she would be if she ate 2 oz of cake. When students rush to calculate 2 oz without first calculating 1 oz they usually do 4(1.00+.60) because 30%+30%=60%.

 When modeling this with an equation a common mistake is for students to write y=x(1.3), mixing up the recursive and explicit method of describing this pattern.
Then, every so often I can tell that students want to know this stuff. I find evidence of a student putting in EXTRA effort to make sense of a problem. #2 show the meaning of each part of this equation. Beautiful.
Here is an available version of the worksheet:
Moore's Law
Learning target: students can make predictions based on exponential growth
Right off the bat I throw this packet at them and ask them to read it. Its the MIT photo essay of various computer chips and transistors throughout computer history.
I ask students what their questions are and I get a range of answers including:
"What is this?"
"How does this relate to what we are doing in class?"
"Why are we reading this?"
So I tell them that the first picture is the birth of the digital age, and give them a brief overview of what a transistor is and how it related to computing power.
From their questions it was clear I was not going to get a question that would involve making a prediction so I gave them the task:
1. how many transistors are their in a computer chip made in 2013/2014?
(This we can look afterwards and see what reasonable answer would be)
2. When will the number of transistors pass the trillion transistor mark?
Step 1: make a guess. I ask students to make a guess, based on what their gut says and the data points. I can steer them a little "what number do you know it has to be bigger than?" Studies show student engagement increases if they make a guess 1st. I had students write down their guesses and I ut them into an excel file.
Step 2: attack! It took a while for students to even begin to start this problem. Then eventually someone figured out they had better make a table just to get something.


Then they found the common differences and realized that wasn't useful, so to set students up for the next part I told them a graph was another strategy they could try. After some time I got the question "Mr. Olson, what should the scale be? How am I going to fit 1 and 371 million on the same graph?" -this will be a great lead in to logarithms.
While trying to make an exponential line of best fit students needed to know how to find the average ratio from year to year. This proved difficult since the data isn't pretty and the years aren't uniform.
Wednesday, November 6, 2013
Exponent rules 4-in-a-row
Learning target: students can apply exponent rules.
 This activity comes from http://busynessgirl.com/exponent-block-and-factor-pair-block/
It was a very engaging way to practice exponent rules, which can be a very dry topic.
 Two students playing one another.
 A veiw of some sample calculations, scratch paper is a must for this activity.
It was a very engaging way to practice exponent rules, which can be a very dry topic.
 Two students playing one another.
 A veiw of some sample calculations, scratch paper is a must for this activity.
What I liked about this is none of my students picked up their calculator.
Exponent rules
Learning target: students can apply exponent rules
to try to shake up the way we take notes on this we make a little booklet of all the exponent rules. I saves the last page for Logarithms and the second to last for examples of solving.


questions to address: if 2^5/2^3=2^2 than what does 2^3/2^5 equal? If all the twos on top cancel out whats left on top? Zero?
how do you expand (3x^2)^3 with the power to a power rule? We need to talk more about making 3=3^1
after which I gave out this A-B sheet stolen from f(t)
Row-game exponent rules
Tuesday, November 5, 2013
Green Ball Bounce
Learning target: students can compare models and make deductions based on multiple representations.
This lesson was meant to be a review of sequences and an introduction to exponential functions, but would also be a good introduction to sequences and recursion in and of itself. I gave students 4 clues and asked them to answer the questions on the cards:

It took a while for students to make sense of the problem and in some classes I had to start them out with a problem statement: On what bounce are the balls closest in height? The other questions are important as well: On what bounce is one ball higher? On what bounce is the other ball higher? ...but sometimes too much at once is crippling.
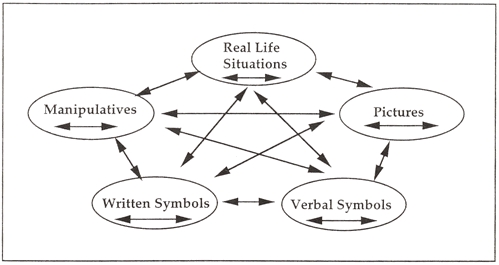
My goal was for students to create multiple representations according to the LESH model:


A great table, but I wish they would have defined what x and y represented.
Students who did not make an adequate enough graph said that the balls were the closest on bounce 4, but they are actually closer on bounce 15, reinforcing the need for thoroughness.
A good looking graph, complete with axis labels. Again, its easy to see that their are two spots where the balls could be the same height. Also, its easier to see which ball bounces higher during which bounce. Students who made an inadequate graph said that the Proportiaball bounces higher from 1-3 bounces but left out the second interval from 16 on. This is a good way to seque into domain as well.

Here is one common misake students make for the Proportiaball, they do the first calculation: 120(1.00-.10) and get 12, then assume that the ball decreases by 12 each time.

Here is good student work showing the calculations, where its easy to see the ratio is always going to be (1.00-.10)

I caught several students who were going to go until the height of the Proportiaball was zero, when I asked them if they thought it was going to get to zero they said yeah, its going down, eventually it will be zero. This thinking leads right into algebraic limits and asymptotes. I brought this concept up to all of my classes and one student responded: "If I walk half the way to the lunchroom, then walk half the remaining distance, then walk half of that remaining distance, and so I won't ever mathematically reach the lunchroom, there will always be a small distance left."
To help with the idea that the Proportiaball never reached the ground I made this geogebra file and zoomed in and zoomed in to show them the function never touches the y-axis:
This student was able to write the recursive equations for each ball. In general, all of my students had a tough time coming up with the explicit exponential equation for this activity.

As a follow up to describing patterns and anticipating exponent rules I gave this homework out
describing exponential patterns HW
This lesson was meant to be a review of sequences and an introduction to exponential functions, but would also be a good introduction to sequences and recursion in and of itself. I gave students 4 clues and asked them to answer the questions on the cards:
It took a while for students to make sense of the problem and in some classes I had to start them out with a problem statement: On what bounce are the balls closest in height? The other questions are important as well: On what bounce is one ball higher? On what bounce is the other ball higher? ...but sometimes too much at once is crippling.
My goal was for students to create multiple representations according to the LESH model:
I tried to get them to draw a picture of what the scenario looked like but was met with a lot of resistance. It would have helped them to determine how many balls and how many people were involved and what questions they had to answer.
Here are some great examples of student work:


A great table, but I wish they would have defined what x and y represented.
Students who did not make an adequate enough graph said that the balls were the closest on bounce 4, but they are actually closer on bounce 15, reinforcing the need for thoroughness.
A good looking graph, complete with axis labels. Again, its easy to see that their are two spots where the balls could be the same height. Also, its easier to see which ball bounces higher during which bounce. Students who made an inadequate graph said that the Proportiaball bounces higher from 1-3 bounces but left out the second interval from 16 on. This is a good way to seque into domain as well.


Here is good student work showing the calculations, where its easy to see the ratio is always going to be (1.00-.10)

I caught several students who were going to go until the height of the Proportiaball was zero, when I asked them if they thought it was going to get to zero they said yeah, its going down, eventually it will be zero. This thinking leads right into algebraic limits and asymptotes. I brought this concept up to all of my classes and one student responded: "If I walk half the way to the lunchroom, then walk half the remaining distance, then walk half of that remaining distance, and so I won't ever mathematically reach the lunchroom, there will always be a small distance left."
To help with the idea that the Proportiaball never reached the ground I made this geogebra file and zoomed in and zoomed in to show them the function never touches the y-axis:
This student was able to write the recursive equations for each ball. In general, all of my students had a tough time coming up with the explicit exponential equation for this activity.

As a follow up to describing patterns and anticipating exponent rules I gave this homework out
describing exponential patterns HW
Sunday, November 18, 2012
Wednesday 11/21/12 - exponential functions
Learning target: students can identify exponential functions


Activity: M&M exponential decay

Homework: none, have a good break!
Activity: M&M exponential decay
Homework: none, have a good break!
Subscribe to:
Posts (Atom)